 There are many ways to look at how energy is consumed in a building and but it is best to understand how much energy is used in total for the entire building for all fuels. Next, it is absolutely critical that the building owner is able to drill down into all of the details by fuel type, cost, usage by building service and usage by equipment type. Using energy profiles is a good way to gain a better understanding how energy is consumed while being able to compare and contrast charts, graphs and consumption data for each building.
Energy Use Index (EUI)
Energy Use Index (EUI) is a unit of measurement that describes the total energy consumption for each building. EUI represents the energy consumed by a building relative to its size, and is expressed in BTUs per square foot per year. It can also be used to compare energy consumption relative to the number of building types or to track consumption from year to year in the same building.
This is a measure of total energy use normalized for floor area, and is used to compare the energy consumption for different buildings. For example, whole-building energy use is measured in kBtu (1000 British thermal units) per square foot, per year, to standardize units between fuels, while electricity use is often expressed as annual KWH per square foot per year.
How is EUI Calculated?
A building’s EUI is calculated by converting annual consumption of all fuels consumed in one year (measured in kBtu) and dividing it by the total square footage of the building. For example, if a 50,000-square-foot school consumed 7,500,000 kBtu of energy last year, its EUI would be 150. A similarly sized school that consumed 9,000,000 kBtu of energy last year would have a higher EUI (180) to reflect its higher energy use. Generally, a low EUI signifies good energy performance.
Building owners and property managers are extremely busy and just want to understand the big picture and understand what it is going to take for them to start saving money. Energy Consumption charts for each calendar day along with energy profile graphs are the best way to summarize where and how energy is being used.
The following examples are energy “Profile” charts that can easily be provided by an energy management software solution.
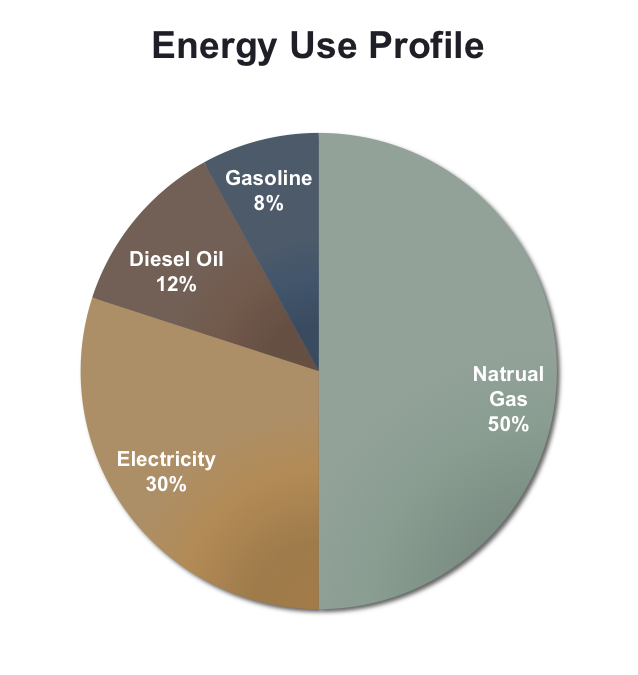
Energy Use Profiles calculate the overall amount and percentage of energy used by the fuel type:
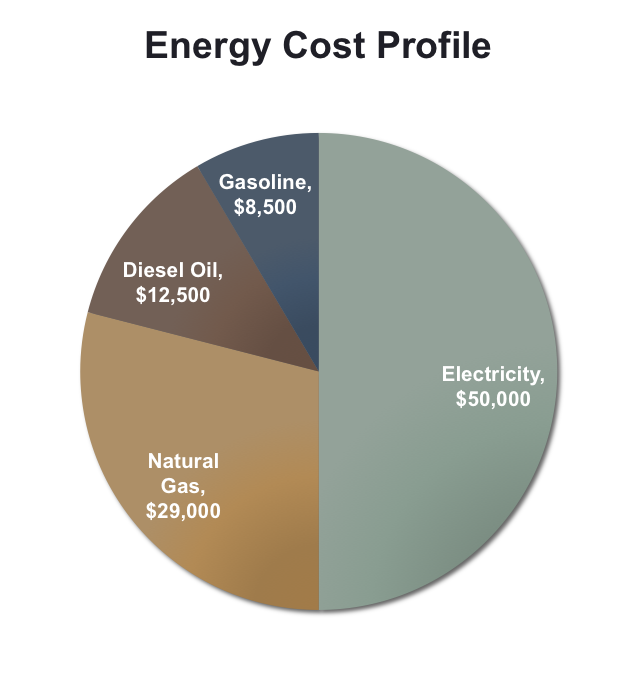
Energy Cost Profiles calculate the overall cost and percentage of energy used by fuel type.
Energy Distribution Profiles calculate how much energy is being consumed by each building service and highlights major areas of energy consumption.
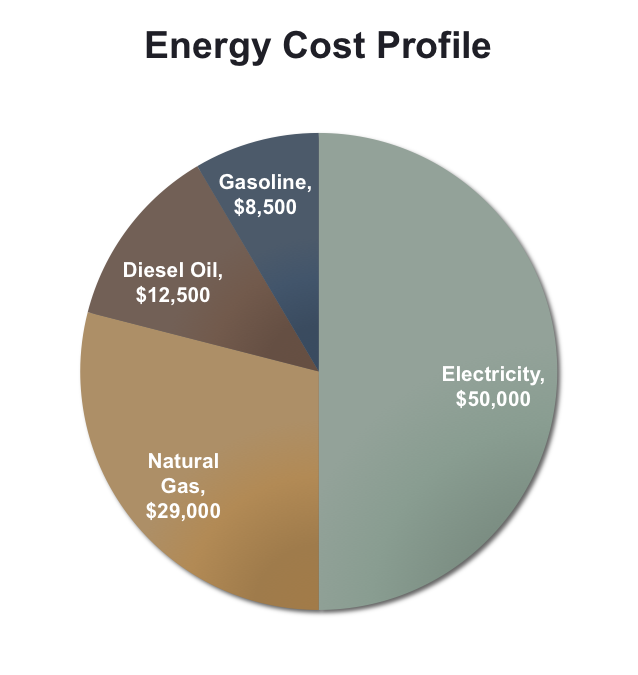
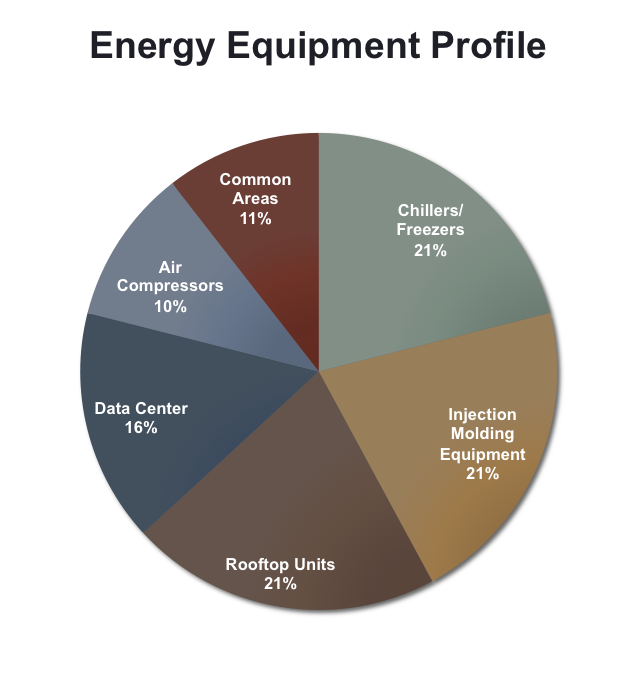
Energy Equipment Profiles calculate how much energy is being consumed by each individual piece of equipment used in the building.
Get Going
 Once you understand how your facility’s electricity use is metered and billed, a good next step is to subscribe to a SaaS (Software as a Service) Energy Management System which would allow you to inquire into a variety of energy consumption graphs and energy use profiles. Being able to visualize operating inefficiencies highlights the areas where you can begin to attack potential savings.
Options for energy conservation and energy efficiency measures can be assessed and prioritized to deliver maximum benefit, ROI and cash flow improvements. Once the projects have been evaluated and prioritized, project tasks can be assigned to your facilities team.
- Implement a “software as a Service” Energy Management Solution that enables online web access to your utility bills, your energy consumption by fuel type and specific operational processes.
- Evaluate and implement energy conservation measures.
Evaluate and implement energy efficiency measures.
[i] Al Thuman, William Younger, Terry Niehaus, Handbook of Energy Audits, Fairmont Press, pages 33 & 34, 8th Edition, 2010


