Category Archives: Use Less Energy

Daily Energy Use ProfileYou can’t manage what you don’t measure. That’s a common phrase that many people use but it can be difficult for building owners and property managers – especially when dealing with older buildings with legacy systems.  In September 2011, Verdantix, an independent analyst firm focused on energy, environment, and sustainability issues, released a report in which they said,  “Optimizing enterprise-wide energy consumption… is a big prize that firms are waking up to. But the vast diversity of energy-consuming assets- lights, security systems, HVAC, boilers, elevators, servers, routers, and manufacturing equipment-means no single application will collect the data from all energy-consuming end points.”

A recent article in Control Engineering noted that the key to successfully implementing an effective energy management program is system integration. This is the only way to simultaneously measure all of the energy-consuming systems that provide heating, cooling, lighting, etc… Unfortunately, this sounds easier than it usually turns out to be. One reason is that most of the energy management products available on the market only address one piece of the energy management puzzle. Another is that these same products are also built on proprietary platforms such that they can’t talk to other solutions that may solve those other pieces.

The Future of Energy Management

The Control Engineering article has the following to say about the benefits of implementing an integrated, enterprise-wide energy management solution:

In May 2012, Verdantix released a report titled “The Future of Energy Management” based on a survey of 210 corporate executives from around the globe with responsibility for making decisions about corporate energy use.

The survey subjects represented companies with at least $250 million in annual revenue in 21 industries. Nearly half the respondents said they plan to make “significant” changes in the way in which they manage energy over the next two years. The survey also revealed that 35% of corporations already have a global energy strategy that revolves around central decision making.

That’s a major shift-especially in the manufacturing sector-from the long-standing practice of allowing corporate divisions, or even individual plants, to make their own energy-management decisions. In fact, 40% of the companies represented in the Verdantix survey still make those decisions at the national level, while 21% still make them at the local level. But it’s clear that those numbers are changing.

“Corporations really are catching on to the strategic importance of energy management,” declares Janet Lin, a senior manager at Verdantix and co-lead of its energy practice. “They also are realizing that central decision making is the foundation for strategic energy management.”

As companies move toward strategic energy management, Lin says they ultimately will find themselves adopting new technology, and they would be well served to heed sound IT project management practices when doing so.

Chief among those practices is determining exactly what the organization wants to accomplish before purchasing any new technology. When it comes to energy management, Lin advises companies to “first look at their usage scenario and pick the category of software with the appropriate functionality.” That method is likely to lead to an incremental approach to implementing comprehensive energy management, starting with the scenarios and solutions that provide the quickest payback.

General Motors saved $50 million in energy costs and reduced its energy intensity 25 percent by working with SAIC to integrate its systems. Since the partnership began 10 years ago, SAIC has executed more than $75 million in energy management projects across multiple contracts for GM, and helped GM avoid more than 778,000 metric tons of excessive greenhouse gas emissions.

Usage Scenarios for Energy Management Software Categories

Communication Protocols

Feras Karim, SAIC senior systems engineer, talks about the difficulties associated with getting these systems to talk to one another. In the past, this has proven very difficult due to the proprietary nature of communication protocols. However, more recently vendors have developed intelligent devices that make them easier to connect to one another. “We can now work with protocol gateway translators,” Karim says. “So if you have systems that talk BACNET, LON, Modbus, Modbus TCP OPC, or other major protocols, you can have a single point to coordinate between different types of devices for a reasonable cost. Previously, if you couldn’t afford an expensive system, you couldn’t do this type of integration.”

For those companies who invest the time and money into these energy management systems, the payback can be substantial. “Just a simple building tune-up, making HVAC equipment more efficient, can render savings of 5% to 15%,” Karim says. “When you go beyond that and start doing things like data mining and making adjustments to implement best practices in scheduling facility and production equipment, you can yield up to a 45% reduction in energy use.”

If you’re interested in a free energy audit, please see how you can Use less energy with our Jump Start Program.

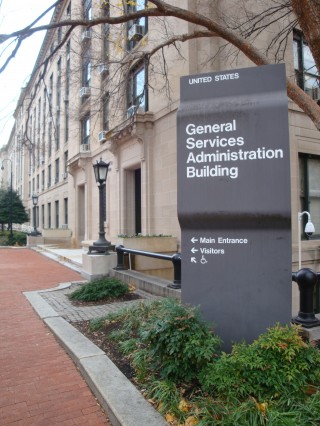
GSA building in Foggy Bottom

GSA building in Foggy Bottom by Herr Vebah on Flickr

Last week, the The U.S. General Services Administration released two new reports regarding innovative building technologies that could help the government use less energy if implemented. They worked with the Department of Energy’s National Laboratories to test the viability of two new key innovations. “This innovative program is another example of GSA leading the way for the federal government,” said Dorothy Robyn, Commissioner of GSA’s Public Buildings Service. “By testing the effectiveness of these technologies, GSA is finding new ways that federal buildings across the nation can save both energy and taxpayer dollars.”

Responsive Lighting

The first of these technologies being evaluated was a package that includes workstation-specific lighting system, dimmable ballasts, occupancy sensors at each luminaire, and controls. There are many government service agencies that work very long hours and could see substantial savings as a result. The GSA notes:

The Responsive Lighting study evaluated the performance of new workstation-specific lighting systems. The study was conducted in five federal buildings in California and Nevada that represented a diverse set of agencies, occupancy patterns, work styles, and lighting. Results showed energy savings that ranged  from approximately 27 to 63 percent over baseline conditions depending on the work space’s normal use. Lighting accounts for 39 percent of electricity costs in office buildings.

Plug Load Control

About 25% of the electrical load in a typical modern office comes from the various peripherals plugged into outlets, like printers, computers and copy machines. The GSA worked with a team from the National Renewable Energy Laboratory (NREL) to test some smart power strips that included three different load-reduction techniques; schedule timer control, load-sensing control, and a combination of the two.

Results showed the APS’ schedule based capability  to be highly effective, reducing plug loads at workstations by 26 percent, and nearly 50 percent in kitchens and printer rooms. This technology could significantly reduce costs, as plug-loads account for  roughly 25 percent of total electricity consumed within office buildings.

GSA owns and leases 9,600 buildings across the country and has the real estate portfolio needed to broadly test and install these technologies. A solicitation for submissions of building technologies to be tested under the GSA’s Green Proving Ground program in FY 2013 will be posted at the agency’s website in the coming weeks.

Changing light bulb

Changing light bulb by USAGYongsan on Flickr

Managing total energy costs over time requires an energy strategy focused on quantity as well as price. Energy conservation measures can go a long way toward lowering consumption and associated costs while achieving sustainability goals and meeting regulatory compliance.

These top four high-impact measures should be included in most energy conservation projects:

  • Lighting Retrofits – Almost always the quickest payback and most profitable energy conservation measure
  • Building Automation Controls – Comparable to lighting in quick payback and cost-effective savings
  • Water Conservation – Among the most aggressive ROI measures to provide big dollar savings and fast paybacks
  • HVAC Upgrades – Can improve efficiency on a large scale

Also reference the DOE – Office Building Energy Checklist

Energy Star logoEnergy Star Portfolio Manager is an interactive energy management tool that allows you to track and assess energy and water consumption across your entire portfolio of buildings in a secure online environment. Whether you own, manage, or hold properties for investment, Portfolio Manager can help you set investment priorities, identify under-performing buildings, verify efficiency improvements, and receive EPA recognition for superior energy performance.

  • Portfolio Manager helps you track and assess energy and water consumption within individual buildings as well as across your entire building portfolio. Enter energy consumption and cost data into your Portfolio Manager account to benchmark building energy performance, assess energy management goals over time, and identify strategic opportunities for savings and recognition opportunities.
  • Portfolio Manager is an interactive energy management tool that allows you to track and assess energy and water consumption across your entire portfolio of buildings in a secure online environment. Whether you own, manage, or hold properties for investment, Portfolio Manager can help you set investment priorities, identify under-performing buildings, verify efficiency improvements, and receive EPA recognition for superior energy performance.
  • Manage Energy and Water Consumption for All Buildings
  • Set Investment Priorities
  • Portfolio Manager provides a platform to track energy and water use trends as compared with the costs of these resources. This is a valuable tool for understanding the relative costs associated with a given level of performance, helping you evaluate investment opportunities for a given building and identify the best opportunities across your portfolio.
  • In order to take advantage of Energy Star software, your energy management solution should provide an automatic feed (or API – Automatic Programming Interface) directly into Energy Star.  This feed eliminates the need for manually entering all of the data each and every month, and allows the building owners to focus on energy conservation and energy efficiency programs.

Person confused about energy billYou may not realize it, but your monthly electric bill is a valuable tool. It tells you what, when and how you spend your energy dollars every month. By knowing how to “translate” these dollars and cents into energy use information, you can identify energy and cost-saving opportunities. Then, after you’ve taken steps to reduce energy use, your bill can act as a “score card” and give you monthly feedback on your progress.

Most electric bills are complex and can be difficult to read or understand. As a property or facility manager, you might not even see them on a monthly basis.

However, the operating decisions you make each day directly affect your bill’s bottom line.   Also, by understanding how energy is measured and billed, you can discover ways to reduce energy cost by controlling when and how energy is consumed.

Typical electric bills are broken down into three major categories of costs:

Delivery Services

Customer charge:  The customer charge recovers costs associated with making service available to a customer, such as installing and maintaining meters, utility poles, power lines and equipment, as well as meter reading and PSNH’s 24-hour customer service center.

Distribution Charge: This charge recovers costs related to the maintenance and operation of PSNH’s distribution system, and PSNH’s power restoration and service operations. The KWH charge is based on the number of kilowatt-hours (KWH) of electricity used during a billing period. The KW charge, or “demand” charge, is based on the greatest amount of electricity used in any half-hour period during a billing period.

Transmission Charge:  This charge recovers costs related to the delivery of electricity over the high-voltage or transmission system power lines. The KWH charge is based on the number of kilowatt-hours (KWH) of electricity used during a billing period. The KW charge, or “demand” charge, is based on the greatest amount of electricity used in any half-hour period during a billing period.

Stranded Cost Recovery Charge:  This charge helps fund the recovery of PSNH’s past investment costs, including expenses incurred through mandated power contracts and other long-term investments and obligations. The KWH charge is based on the amount of kilowatt-hours (KWH) of electricity a customer has used during a billing period. The KW charge, or “demand” charge, is based on the greatest amount of electricity used in any half-hour period during a billing period. A portion of this charge is owned by PSNH Funding LLC and is being collected on its behalf.

System Benefits Charge:  This charge funds energy efficiency programs for all customers as well as assistance programs for residential customers within certain income guidelines.

Deregulated Supply

Energy Charge:  This charge is based on the amount of kilowatt-hours (KWH) of electricity a customer has used during a billing period. It includes a supplier’s costs to generate and/or buy power.

Taxes

Electricity Consumption Tax:  This is a state-mandated tax on electricity consumption.

Get Going

Once you understand how your facility’s electricity use is metered and billed, you can better manage your energy consumption. Next, taking the steps necessary to make operational changes to reduce these costs becomes a lot easier. For example, energy and cost-saving steps can include:

  • Comparing the present bill with the bill for the same billing period in the previous year, not the previous month. There can be various usage differences in a month-to-month comparison, such as warmer or cool weather conditions or holidays.
    Sailor switches his lights to high efficiency bulbs

    Image courtesy of US Navy on Flickr

  • Developing a comprehensive energy and cost reduction plan and sharing it with your employees, and submitting the application for your building’s “Energy Star” rating.
  • Making utility costs known to employees.
  • Getting copies of your electric bills and keeping track of monthly expenses and usage with an energy management software solution.
  • Setting goals and targets for both energy consumption reduction and demand reduction.
  • Looking for periods of unusually high or abnormal energy use and determining the cause.
  • Identifying the time of your peak demand, determining causes of this peak, and finding ways to reduce it. Consider possible strategies for shifting equipment operations into utility off-peak periods.
  • Identifying equipment that runs excessively and using automatic controls to shut it down when not needed.
  • Setting controls so that operation is staggered (for instance two pumps that need to operate only one hour per day should be controlled so as not to operate at the same time).
  • Understanding that utilities have different rates for different types of customers. Talk with your utility representative, and make sure you are being charged the correct rate for your facility. Inquire if there are programs offered that will allow lower rates.
  • Implementing energy conservation and efficiency measures.

Energy Use ProfileThere are many ways to look at how energy is consumed in a building and but it is best to understand how much energy is used in total for the entire building for all fuels.  Next, it is absolutely critical that the building owner is able to drill down into all of the details by fuel type, cost, usage by building service and usage by equipment type. Using energy profiles is a good way to gain a better understanding how energy is consumed while being able to compare and contrast charts, graphs and consumption data for each building.

Energy Use Index (EUI)

Energy Use Index (EUI) is a unit of measurement that describes the total energy consumption for each building. EUI represents the energy consumed by a building relative to its size, and is expressed in BTUs per square foot per year.  It can also be used to compare energy consumption relative to the number of building types or to track consumption from year to year in the same building.

This is a measure of total energy use normalized for floor area, and is used to compare the energy consumption for different buildings. For example, whole-building energy use is measured in kBtu (1000 British thermal units) per square foot, per year, to standardize units between fuels, while electricity use is often expressed as annual KWH per square foot per year.

How is EUI Calculated?

A building’s EUI is calculated by converting annual consumption of all fuels consumed in one year (measured in kBtu) and dividing it by the total square footage of the building. For example, if a 50,000-square-foot school consumed 7,500,000 kBtu of energy last year, its EUI would be 150. A similarly sized school that consumed 9,000,000 kBtu of energy last year would have a higher EUI (180) to reflect its higher energy use. Generally, a low EUI signifies good energy performance.

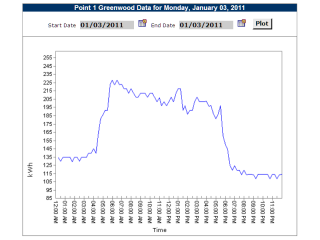
Building owners and property managers are extremely busy and just want to understand the big picture and understand what it is going to take for them to start saving money.  Energy Consumption charts for each calendar day along with energy profile graphs are the best way to summarize where and how energy is being used.

The following examples are energy “Profile” charts that can easily be provided by an energy management software solution.

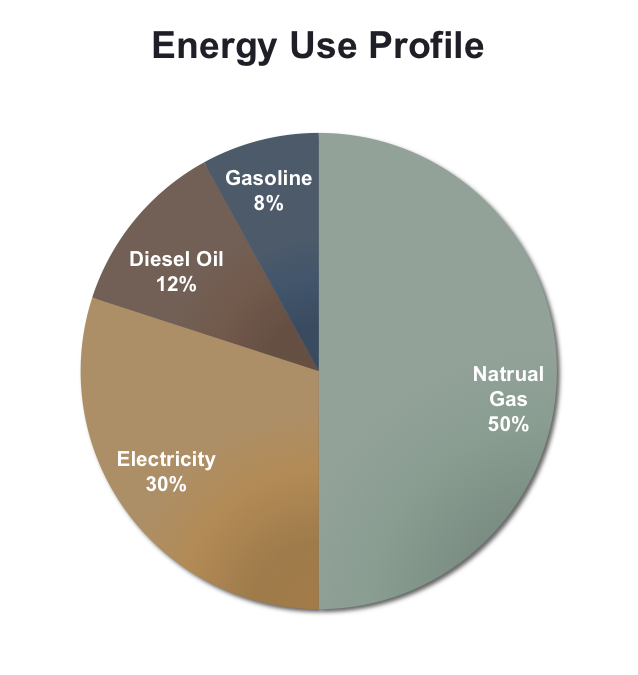
Energy Use Profiles calculate the overall amount and percentage of energy used by the fuel type:

Sample Energy Use Profile

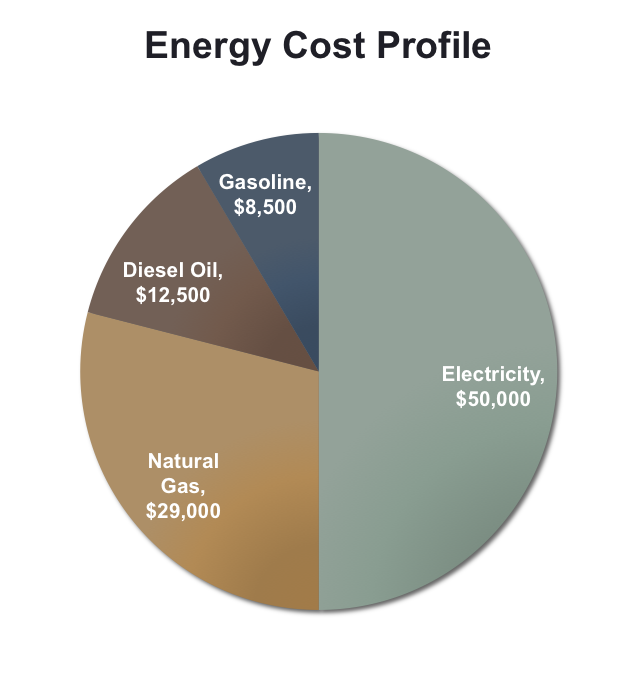
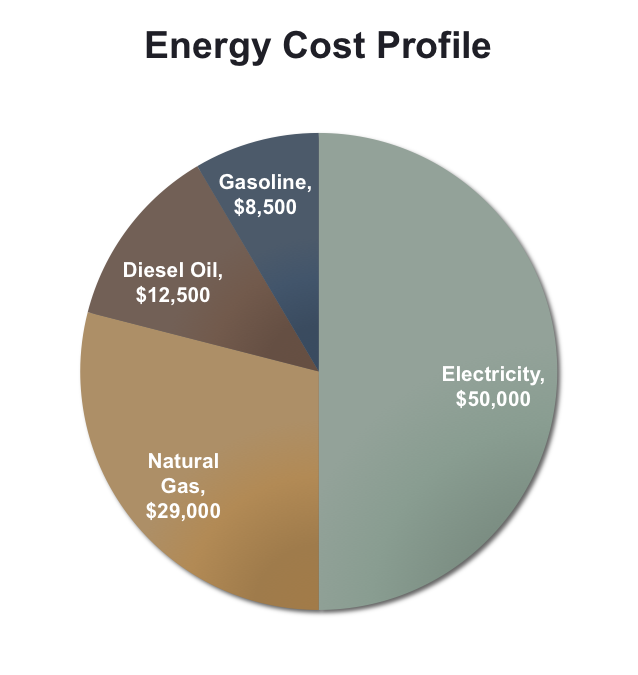
Energy Cost Profiles calculate the overall cost and percentage of energy used by fuel type.

Sample Energy Cost Profile


Energy Distribution Profiles calculate how much energy is being consumed by each building service and highlights major areas of energy consumption.

Sample Energy Cost Profile

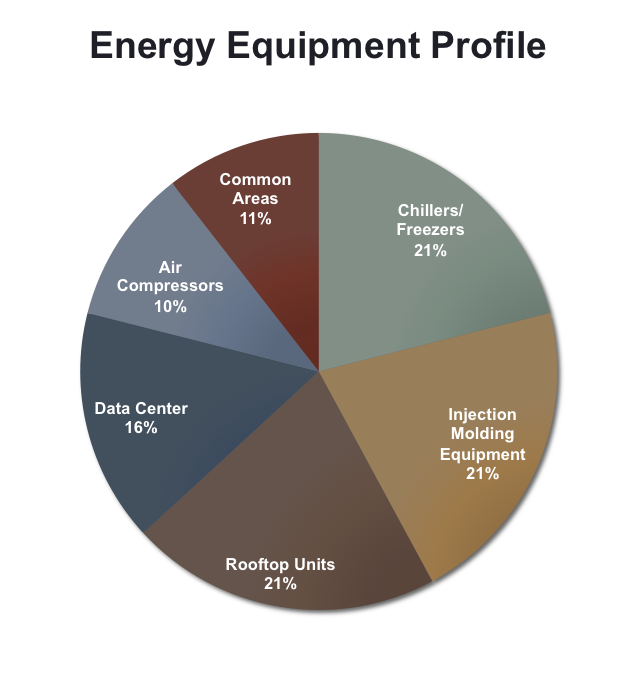
Energy Equipment Profiles calculate how much energy is being consumed by each individual piece of equipment used in the building.

Sample Energy Equipment Profile

Get Going

If not now, when?Once you understand how your facility’s electricity use is metered and billed, a good next step is to subscribe to a SaaS (Software as a Service) Energy Management System which would allow you to inquire into a variety of energy consumption graphs and energy use profiles.  Being able to visualize operating inefficiencies highlights the areas where you can begin to attack potential savings.

Options for energy conservation and energy efficiency measures can be assessed and prioritized to deliver maximum benefit, ROI and cash flow improvements.  Once the projects have been evaluated and prioritized, project tasks can be assigned to your facilities team.

  • Implement a “software as a Service” Energy Management Solution that enables online web access to your utility bills, your energy consumption by fuel type and specific operational processes.
  • Evaluate and implement energy conservation measures.

Evaluate and implement energy efficiency measures.


[i] Al Thuman, William Younger, Terry Niehaus, Handbook of Energy Audits, Fairmont Press, pages 33 & 34, 8th Edition, 2010