Monthly Archives: August 2012

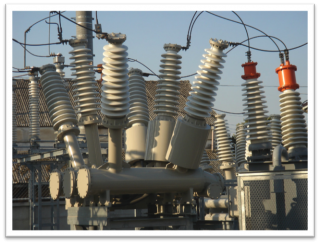
electric utility transformersTypical utility rate structures are divided into three categories reflected on your electricity or natural gas bill:  customer charges, demand charges, and supply charges. Each charge is designed to cover specific costs incurred by a regulated utility. The bill also includes provision taxes that vary depending on your utility and local government.

Customer Charge

The first category is customer charges. These charges vary with the number of customers, but not the amount used by any particular customer. Customer charges recover costs associated with making service available to the customer, such as installing and maintaining meters, utility poles, power lines and equipment as well as meter reading and customer service costs. Most utilities charge a flat fee customer charge and it does not vary according to usage.

Demand Charge

The second utility rate category is called demand costs. Electric and natural gas utilities must be able to meet peak demand. Peak demand is the period of time when the greatest number of users is simultaneously using service. Overall system requirements for energy transmission and delivery drive demand related costs. Costs associated with the demand charge include:  capital and operating costs for production, transmission, equipment (transformers) and storage costs that vary with demand requirements.

Supplier Charge

The third component of an electricity or natural gas bill is the energy/commodity costs or supply charges. The supply charge consists of the costs associated with capital and operating costs to produce the energy, such as fuel costs and production supplies. These costs change only with the consumption of energy and they are not affected by the number of customers or overall system demand.

How Utilities Calculate Charges

The rates you pay are calculated differently for each charge category. The rates are typically based on total consumption or peak demand. The formulas for rate calculations are as follows:

Customer charge = fixed monthly charge

Demand charge = dollars x demand

Supply charge = dollars x energy use
Energy/fuel cost adjustment = dollars x energy use

Tax/surcharge = one or more of items 1-3 above
By tax %, dollars x energy use, or dollars x demand

Energy Use ProfileThere are many ways to look at how energy is consumed in a building and but it is best to understand how much energy is used in total for the entire building for all fuels.  Next, it is absolutely critical that the building owner is able to drill down into all of the details by fuel type, cost, usage by building service and usage by equipment type. Using energy profiles is a good way to gain a better understanding how energy is consumed while being able to compare and contrast charts, graphs and consumption data for each building.

Energy Use Index (EUI)

Energy Use Index (EUI) is a unit of measurement that describes the total energy consumption for each building. EUI represents the energy consumed by a building relative to its size, and is expressed in BTUs per square foot per year.  It can also be used to compare energy consumption relative to the number of building types or to track consumption from year to year in the same building.

This is a measure of total energy use normalized for floor area, and is used to compare the energy consumption for different buildings. For example, whole-building energy use is measured in kBtu (1000 British thermal units) per square foot, per year, to standardize units between fuels, while electricity use is often expressed as annual KWH per square foot per year.

How is EUI Calculated?

A building’s EUI is calculated by converting annual consumption of all fuels consumed in one year (measured in kBtu) and dividing it by the total square footage of the building. For example, if a 50,000-square-foot school consumed 7,500,000 kBtu of energy last year, its EUI would be 150. A similarly sized school that consumed 9,000,000 kBtu of energy last year would have a higher EUI (180) to reflect its higher energy use. Generally, a low EUI signifies good energy performance.

Building owners and property managers are extremely busy and just want to understand the big picture and understand what it is going to take for them to start saving money.  Energy Consumption charts for each calendar day along with energy profile graphs are the best way to summarize where and how energy is being used.

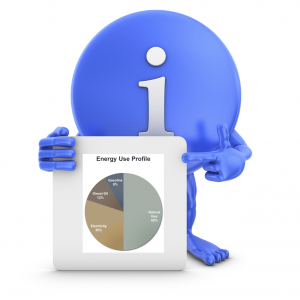
The following examples are energy “Profile” charts that can easily be provided by an energy management software solution.

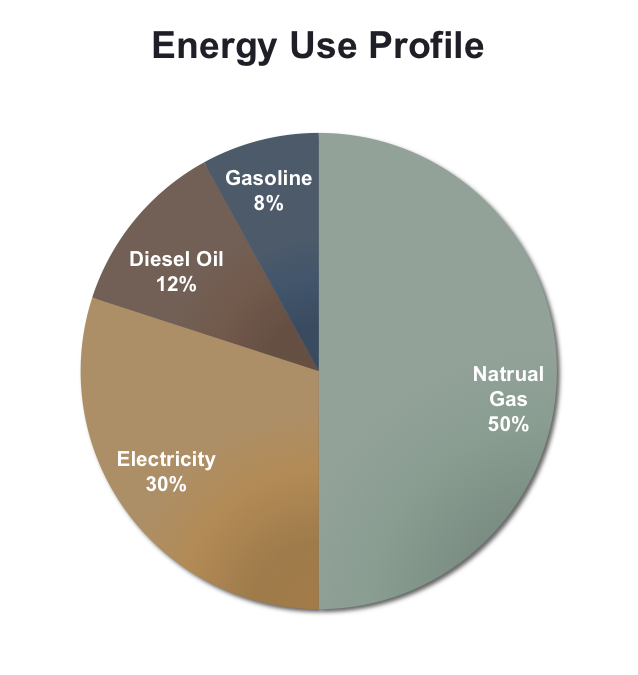
Energy Use Profiles calculate the overall amount and percentage of energy used by the fuel type:

Sample Energy Use Profile

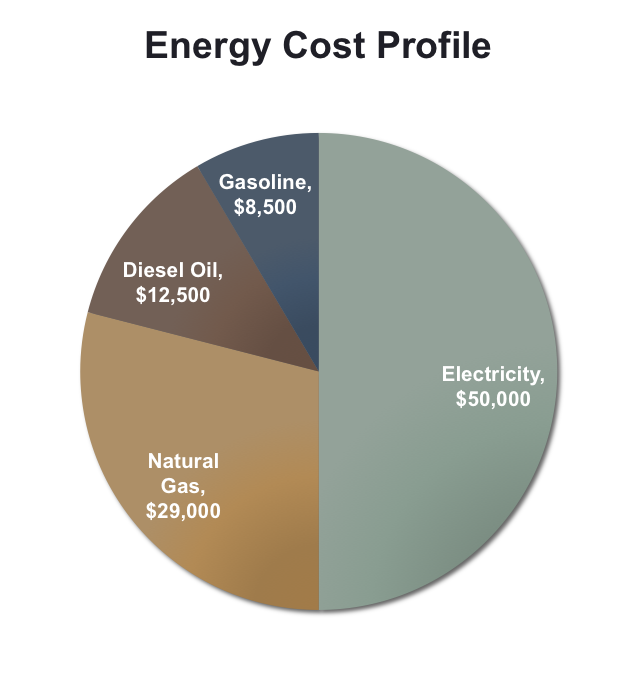
Energy Cost Profiles calculate the overall cost and percentage of energy used by fuel type.

Sample Energy Cost Profile


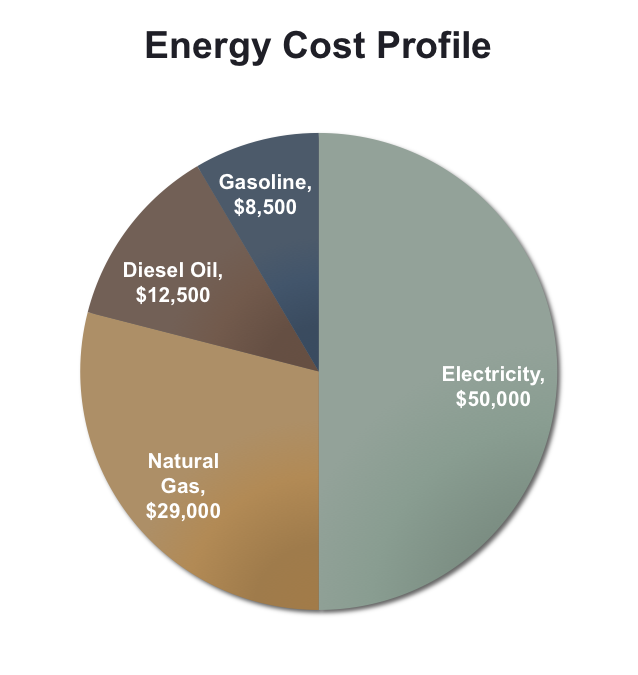
Energy Distribution Profiles calculate how much energy is being consumed by each building service and highlights major areas of energy consumption.

Sample Energy Cost Profile

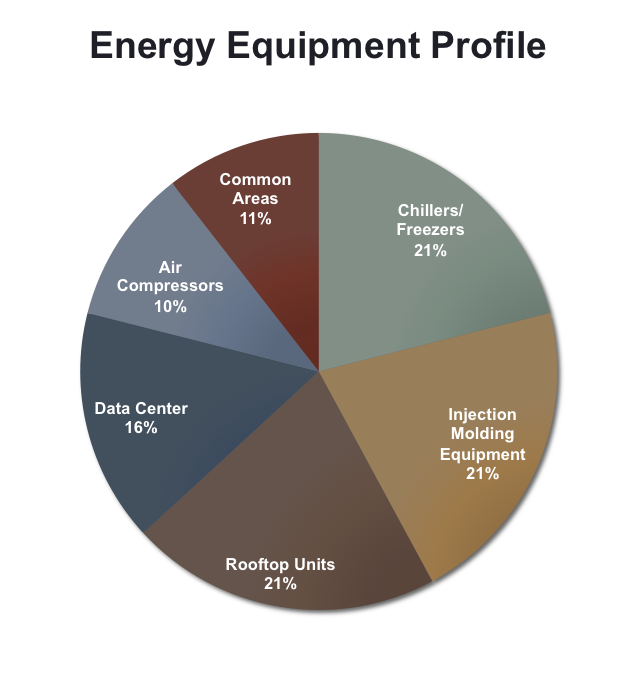
Energy Equipment Profiles calculate how much energy is being consumed by each individual piece of equipment used in the building.

Sample Energy Equipment Profile

Get Going

If not now, when?Once you understand how your facility’s electricity use is metered and billed, a good next step is to subscribe to a SaaS (Software as a Service) Energy Management System which would allow you to inquire into a variety of energy consumption graphs and energy use profiles.  Being able to visualize operating inefficiencies highlights the areas where you can begin to attack potential savings.

Options for energy conservation and energy efficiency measures can be assessed and prioritized to deliver maximum benefit, ROI and cash flow improvements.  Once the projects have been evaluated and prioritized, project tasks can be assigned to your facilities team.

  • Implement a “software as a Service” Energy Management Solution that enables online web access to your utility bills, your energy consumption by fuel type and specific operational processes.
  • Evaluate and implement energy conservation measures.

Evaluate and implement energy efficiency measures.


[i] Al Thuman, William Younger, Terry Niehaus, Handbook of Energy Audits, Fairmont Press, pages 33 & 34, 8th Edition, 2010

1) Scan/email/fax your utility bills to your broker.

The broker will provide this information to qualified suppliers who need historical usage information to price the various competitive supply contracts they will offer you. Most information is obtained from your most recent bills. The suppliers may also request a signed LOA (letter of authorization) granting them permission to pull historical usage data directly from the utility. Either way, providing this information simply allows the suppliers to price the products and never locks you into any product.

2) Review pricing proposals, terms and contract length.

You should receive quotes from different suppliers for different products. Pay close attention to the pricing and the term of the contract. Also, make sure you understand the difference between fixed and variable priced products. The lowest current rate may not always be the best product for your specific situation. You must determine your risk tolerance and then evaluate the proper product to meet your needs.  A qualified broker can help you navigate this process by explaining the different products and negotiating with the suppliers on your behalf.

3) Choose the supplier with the best price and product to suit your specific needs.

After fully evaluating the different options, choose the right product for your situation. You will be presented with a supplier agreement. Read the agreement carefully and make sure it is consistent with the terms and conditions you have agreed to.

4) Monitor your utility bills to evaluate year-over-year savings and returns.

This optional fourth step will help you close the loop to ensure that your firm is actually receiving the benefits and savings from your deregulated energy supplier.  Monitoring can be as simple as using an Internet browser to view your energy bills. You will be able to view energy consumption data in aggregate and by fuel type for a single building or for all of the buildings in your portfolio.

rising business performanceThere are many options for evaluating energy savings ROI (return on investment).  “Payback” is still the most widely used measure of value and describes the number of years it takes for the cost of an investment to be recovered through the annual savings that it provides.

Many industry corporate managers are often not impressed by proposed energy savings.  Yet the same results may be enthusiastically received when impacts are related to Key Performance Indicators (KPIs) of the client’s business operations.  This means expressing a reduction in energy use (or cost) per unit that the business uses to measure output and productivity on a daily basis:  tons of product, barrels of product, gallons per revenue passenger mile, energy costs per square foot, energy cost per meal served in a restaurant, BTUs per employee, or the total annual energy spent as a percentage of net income.

Defining your energy costs of production is an essential step to understanding how energy affects your productivity and profit margin.  Businesses are best served by making the additional effort to carry the efficiency project ROI, Payback and Savings calculations out one step further and applying the energy costs/ savings to the functional business KPIs that represent the strategic purpose of the business.

Once the energy efficiency projects are brought back full circle and get measured in day-to-day operational terms the company will achieve true synergistic reductions in energy use.

Get Going

Armed with total energy usage data, meter data, Energy Star rankings and a prioritized list of Key Performance Indicators (KPIs), a Facilities Manager is prepared to establish a list of operational units of output that can be directly tied to energy consumed.  Conversely, all energy conservation measures and energy efficiency measures can now be expressed in operational business terms

  • Define your organizational business metrics or production measurements.
  • Redefine your current energy efficiency project in terms of Business KPIs.
  • Create company, employee and/or tenant awareness with lobby and cafeteria based energy reporting kiosks.
  • Establish an on-going measurement, monitoring and tracking program for these newly established KPIs.